
Two weeks ago I wrote this article that detailed the declining rate of errors being given by official scorers over time. One of the logical issues that follow is the degree to which it affects pitchers' ERA line. Obviously if there are fewer errors being issued, then it likely means there are more runs being credited to pitchers as earned. So exactly how many more runs have been getting charged to pitchers than in the past?
It was in 1969 that MLB lowered the pitcher's mound to the current specifications, and it clearly did have a material impact. For simplicity's sake I'm going to start in 1970 with this investigation and again go in five-year increments plus the last year we have full data for in 2012.
1970 | 1975 | 1980 | 1985 | 1990 | 1995 | 2000 | 2005 | 2010 | 2012 | |
ERA | 3.89 | 3.71 | 3.84 | 3.89 | 3.86 | 4.45 | 4.77 | 4.29 | 4.08 | 4.01 |
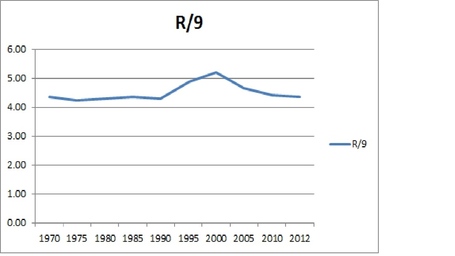
League wide ERA was pretty static for about 20 years right around the mid-high 3.80's except for that dip in 1975. The 1995-2005 bump up in ERA is likely what people will refer to as the steroid era. Since then the figure has come back down some, but it is still above that 3.80 area it stayed in for so long after the mound change. That difference is really nothing more than the official scorer's impact on the pitcher's line. To best exemplify this I took all of the runs scored league wide, and then divided the total innings pitched by nine. So the metric I'm going to show I'll call Runs per Nine Innings: R/9. This avoids any peculiarities in a given season from excessive extra inning affairs. What becomes apparent is that there really isn't any difference anymore in the amount of runs being scored now versus 40 years ago. This is after all what really matters anyway. No one asks what the earned run score of the game was last night.
1970 | 1975 | 1980 | 1985 | 1990 | 1995 | 2000 | 2005 | 2010 | 2012 | |
R/9 | 4.36 | 4.22 | 4.29 | 4.35 | 4.29 | 4.88 | 5.20 | 4.65 | 4.43 | 4.36 |
Honestly I'm totally sick and tired of the whole PED thing and that started before the recent brew-ha. However, this very simple data concerning R/9 might be the best argument I've seen about the impact on baseball. That completely ignores pitchers using these substances, and I honestly don't care enough anymore to try and figure out using numbers. However, if you believe that PED's inflated offense then you should take some heart that it looks like the impact is now almost completely out of the game.
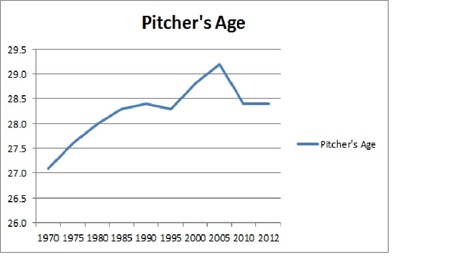
There is another interesting correlation with the 1995-2005 period that probably also explains the increased offense. It turns out that during that period the average age of MLB pitchers also increased. Considering that pitcher velocity declines at about 29 years of age and then again at about 32-33 years old, I don't find it at all surprising to see runs increase around the league when the average age also increased above that 29 figure. It's now dipped back down to where it was in the 1980's. The fact that it doesn't go back towards 27 years of age is likely due to the effect that long term contracts for elite talent is having on the aggregate.
1970 | 1975 | 1980 | 1985 | 1990 | 1995 | 2000 | 2005 | 2010 | 2012 | |
PitchAge | 27.1 | 27.6 | 28.0 | 28.3 | 28.4 | 28.3 | 28.8 | 29.2 | 28.4 | 28.4 |
R/9 | 4.36 | 4.22 | 4.29 | 4.35 | 4.29 | 4.88 | 5.20 | 4.65 | 4.43 | 4.36 |
There also may be another reason for the higher average age of pitchers now versus the 1970's, and I admit that it was the primary reason I started to look at this data to begin with. Will Carroll wrote an interesting article earlier in the year about how 1/3rd of all current MLB pitchers have had Tommy John surgery. The recent bad news concerning Matt Harvey turned my thoughts back to that fact. Considering that procedure was first performed in 1974, and now 33% of all pitchers at the MLB level have had the surgery, one has to wonder if this might not be the reason why the average age of pitchers has moved up so much.
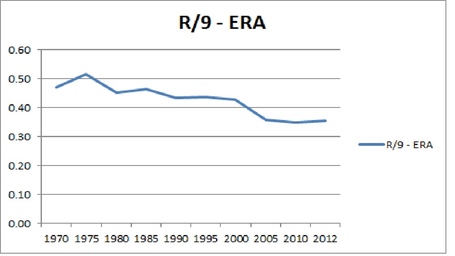
To conclude, official scorers have been altering their definition of an error continually over time issuing fewer per play. Total runs per nine innings is now back to where it was about 30-40 years ago, but the combined MLB pitchers' ERA is still higher. How much? The difference is about 10-15 basis points. Doesn't sound like much, but it looks worse on the chart. Most people also think a 4.00 ERA sounds pretty average, but I'm guessing a 3.85 line might be viewed a bit more favorably.
1970 | 1975 | 1980 | 1985 | 1990 | 1995 | 2000 | 2005 | 2010 | 2012 | |
R/9 | 4.36 | 4.22 | 4.29 | 4.35 | 4.29 | 4.88 | 5.20 | 4.65 | 4.43 | 4.36 |
ERA | 3.89 | 3.71 | 3.84 | 3.89 | 3.86 | 4.45 | 4.77 | 4.29 | 4.08 | 4.01 |
R/9 - ERA | 0.47 | 0.51 | 0.45 | 0.46 | 0.43 | 0.43 | 0.43 | 0.36 | 0.35 | 0.35 |
The advent of advanced statistics in baseball has become considerably more main-stream over the last decade. Despite the debate last year over MVP titles and WAR, the fact that stats like OBP have now become common place is testament to the change in acceptance. Most of the debate has centered not on whether statistics represent value or not, but on how much value certain statistics should be weighted. Proponents of the new label the old as ineffective. I think we can add another stat to that reject pile. You want to dump the Win category? How about we dump the ERA too? The more we move the subjective influence of the official scorer out of the equation the better. Let's give R/9 a shot. It's simple, and it gets right to the heart of the matter. With that in mind, here are the AL starting pitcher leader-board in R/9 entering play into Wednesday, and note that they do not match with ERA. In fact, the starting pitcher leading the league in ERA is fourth in R/9.
Rank | Name | R/9 | ERA |
1 | 2.79 | 2.68 | |
2 | 2.83 | 2.73 | |
3 | 2.83 | 2.63 | |
4 | 2.87 | 2.61 | |
5 | 2.87 | 2.71 | |
6 | 3.04 | 2.97 | |
7 | 3.23 | 3.03 | |
8 | 3.24 | 3.14 | |
9 | 3.30 | 3.00 | |
10 | 3.45 | 3.08 |
'+couponFullDescription+'
Offer Ends: '+couponExpireDisplay+'


