
For the second straight season, the Rays are enjoying a surprising season from a cast-off closer. This season, Fernando Rodney and last season, it was Kyle Farnsworth. In both cases, the original signing was mocked nationally and questioned everywhere, but the results have been nothing short of incredible. That said, Farnsworth's encore has not gone as well as planned. The team exercised its option on Farnsworth, but the reliever's elbow strain delayed him from making his debut until June 30th of this season.
A case can be made to overlook that July 4th outing as a poor decision by Joe Maddon in asking the reliever to enter a game in an extremely high leverage situation in just his second game back. Half of the earned runs that Farnsworth has allowed came from that game as he put four of the five batters on base via a walk in that game.
Outside of one rather high-profile regrettable outing against the Yankees on July 4th, Farnsworth's results have been very much in line with what he did last season even though the team has scaled back his usage. Part of that could be related to the success of the starting pitchers being able to work deep into games, but Farnsworth has yet to make a multiple-inning appearance this season after doing so six times in 2011.
His usage process has changed, but has anything else changed?
In watching Farnsworth pitch, it is clear he is not throwing as hard as he did last season. The numbers back up what most have observed as well (data courtesy of BrooksBaseball):
| PITCH | CAREER | 2011 | 2012 |
| FA | 96.4 | 96.7 | 95.4 |
| SI | 94.1 | 94.0 | 92.6 |
| FC | 89.9 | 90.3 | 88.4 |
| SL | 86.4 | 87.0 | 86.4 |
This is not unusual considering Farnsworth late start to the season on top of the issues toward the end of the 2011 season. Despite the decrease in velocity, Farnsworth has struck out a higher percentage of the batters he has faced thus far in 2012 than he did last season. Additionally, opponents are hitting just .172 against him in 2012 which is a 36 point drop from their success in 2011. He is also creating slightly more swinging strikes in 2012 as he has raised his 10.2 percent rate in 2011 to 11.2 percent this season.
In looking at his PITCHf/x plate discipline metrics at Fangraphs, we see that batters are chasing less pitches out of the zone against him, swinging less often overall, but batters are also seeing a smaller percentage of strikes thrown. In 2011, 56.7 percent of the pitches Farnsworth threw were in the strike zone while just 49.4 percent have been in the strike zone this season.
The velocity is down from last season, his frequency within the strike zone is down from last season, hitters are chasing less pitches out of the zone, and yet his strikeout rate is up this season? How is Farnsworth accomplishing this magic?
Part of it has to do with a slight change in his pitch mixture. In 2011, the cutter was Farnsworth's secondary pitch du jour as he used the pitch 21 percent of the time. This season, he has put that pitch in his back pocket more frequently and has gone back to his slider
| PITCH | CAREER | 2011 | 2012 |
| FA | 35% | 22% | 22% |
| SI | 27% | 37% | 36% |
| FC | 16% | 21% | 17% |
| SL | 22% | 20% | 25% |
As Bradley Woodrum pointed out, Farnsworth's slider was the ninth-best such pitch in baseball last season. In 2011, Farnsworth threw the pitch 32 percent of the time to lefties in two-strike counts and 22 percent of the time to righties in those counts. Yet, it was a pitch Farnsworth favored when he was ahead in the count as his usage of his dropped considerably when the batter was ahead in the count (via Brooks):

This season, Farnsworth has changed a few things, most notably how he attacks lefties and righties in two-strike counts. His slider usage to finish off lefties has spiked dramatically while his usage of his fourseam fastball to righties has gone up even more (via Brooks):
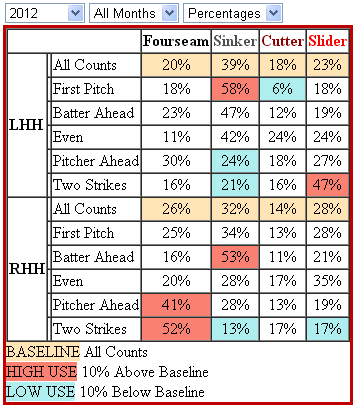
Not only is he changing his pitch mixture and usage of the pitches, he is also changing where he is locating those pitches. First, two plots to compare his slider location in 2011 to 2012:

Since he has de-emphasized the pitch to righties, the pitch is now mostly coming in on the hands or lower to lefties and less frequently within the strike zone. To make up for that, notice where Farnsworth is now using his fourseam fastball compared to last season:
Farnsworth has thrown 243 pitches this season, 39 percent for balls and 61 percent for strikes. That is only slightly below the league-wide average of 38/62. The high walk rate this season comes from one forgettable appearance in a regrettable implementation of using a pitcher fresh off the disabled list in a high leverage situation against a very disciplined team that does not chase pitches out of the zone.
Farnsworth may not be the guaranteed shutdown reliever that he was last season, but this new version of him is not too shabby either. Since that outing against the Yankees, Farnsworth has limited opponents to a .401 OPS and through 68 batters faced this season, he has yet to allow an extra base hit.